Know what each marketing channel really brings in, and where to put your next dollar
Marketing Mix Modelling (MMM) measures the impact of every marketing activity on your business KPI, and shows how to set and split your budget across channels and platforms.

What MMM lets you do
Measure each channel's impact
See how much of your KPI each channel and platform actually drives, separated from your baseline, seasonality and other factors.
Optimize your budget
Find the return on investment of each channel and how to reallocate spend across channels and platforms to get more from the same budget.
Our process: the CRISP-DM data science cycle
Every MMM project follows the same proven steps.
- 1
Business & problem understanding
We learn your business, your marketing and the questions the model must answer.
- 2
Define success criteria
We agree on the KPI, the decisions the model supports and how we judge it accurate.
- 3
Collect data
We gather the KPI, marketing activity by channel and platform, and control variables.
- 4
Validate & prepare data
We check, clean and align every series so the model learns from reliable data.
- 5
Modelling
We build and tune the model of how each channel drives your KPI.
- 6
Evaluation & results
We check the fit, then deliver channel impacts, returns and budget recommendations.
A living model that keeps getting more accurate
We don't deliver a model once and walk away. We keep the model, refresh it with new data, and calibrate it with incrementality tests until it reflects your marketing environment closely.
Month 0
First model version
We release the first version of your MMM with its results.
Months 0–6
Incrementality tests
We plan and run incrementality tests to validate the model's channel estimates.
Month 6
Refresh & calibrate
We refresh the model with the new data and calibrate it with the test results.
Every cycle
Repeat
New tests, new data, a new refresh: each cycle brings the model closer to your reality.
Example results
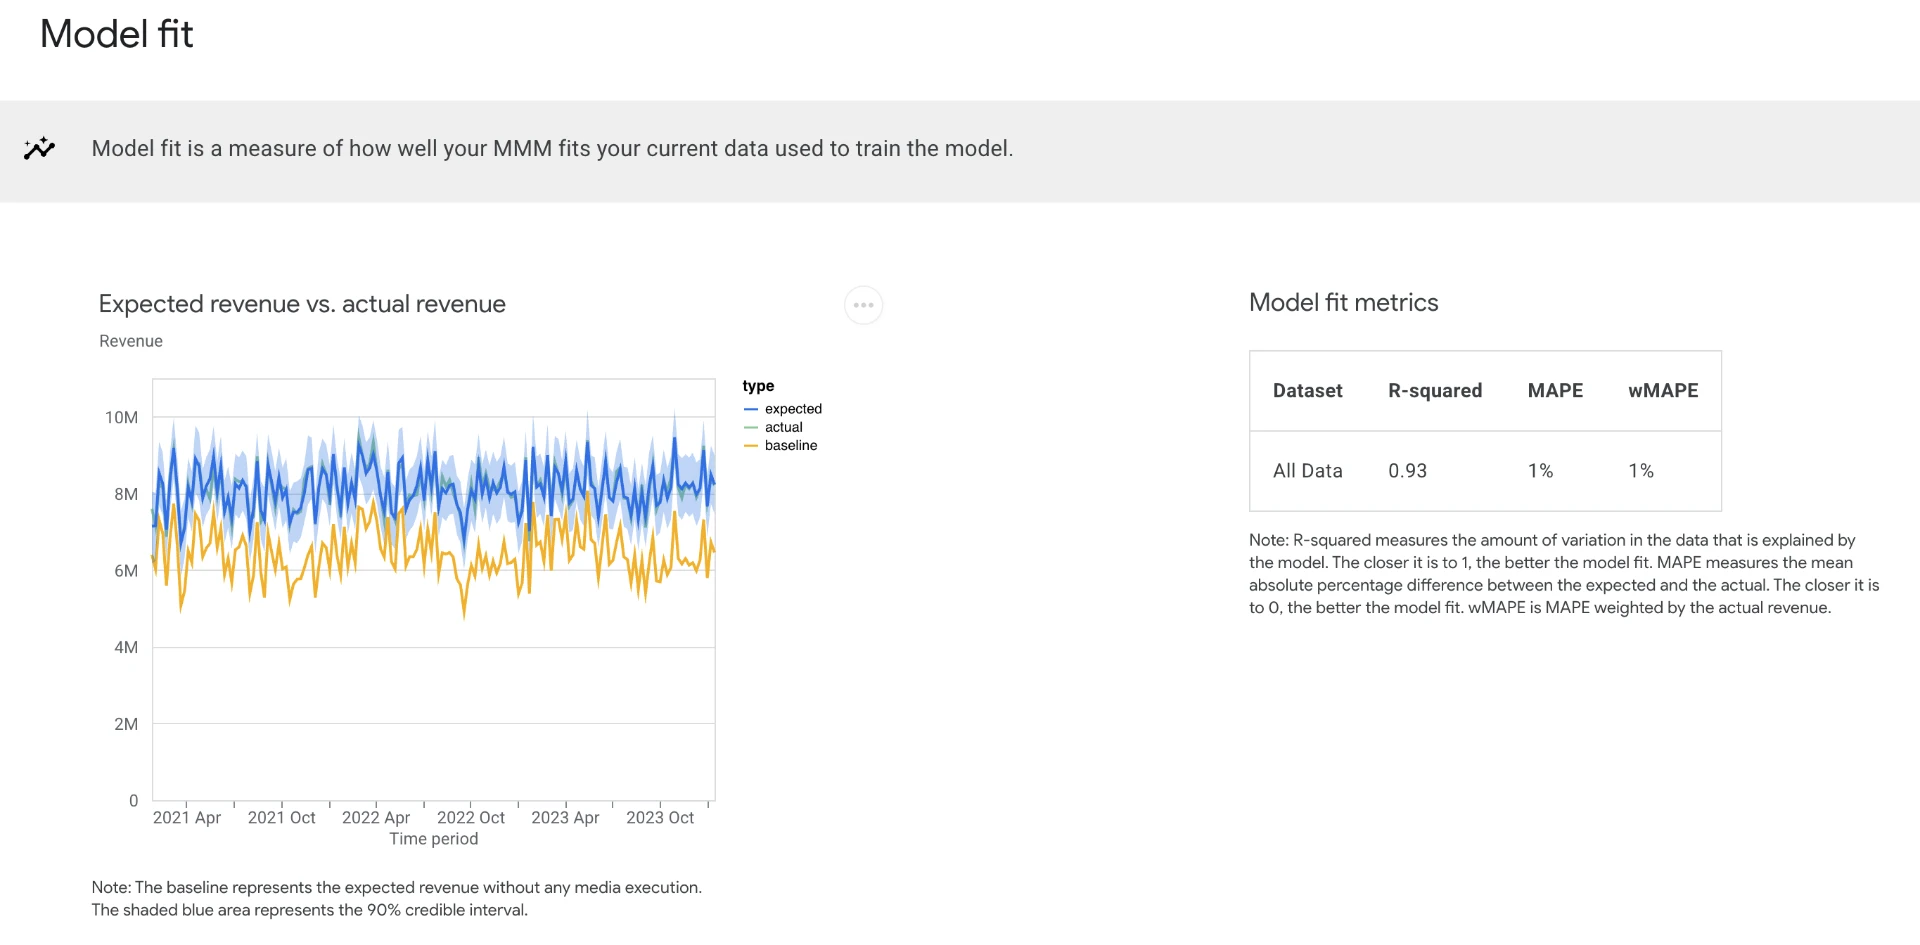
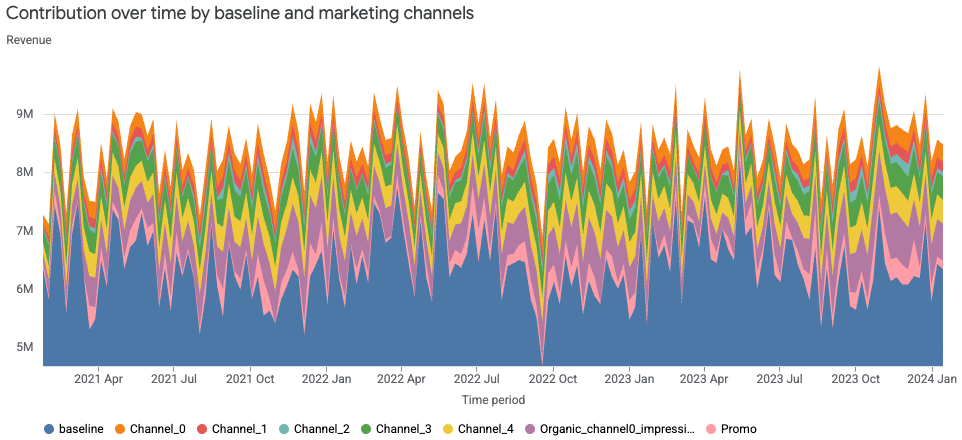
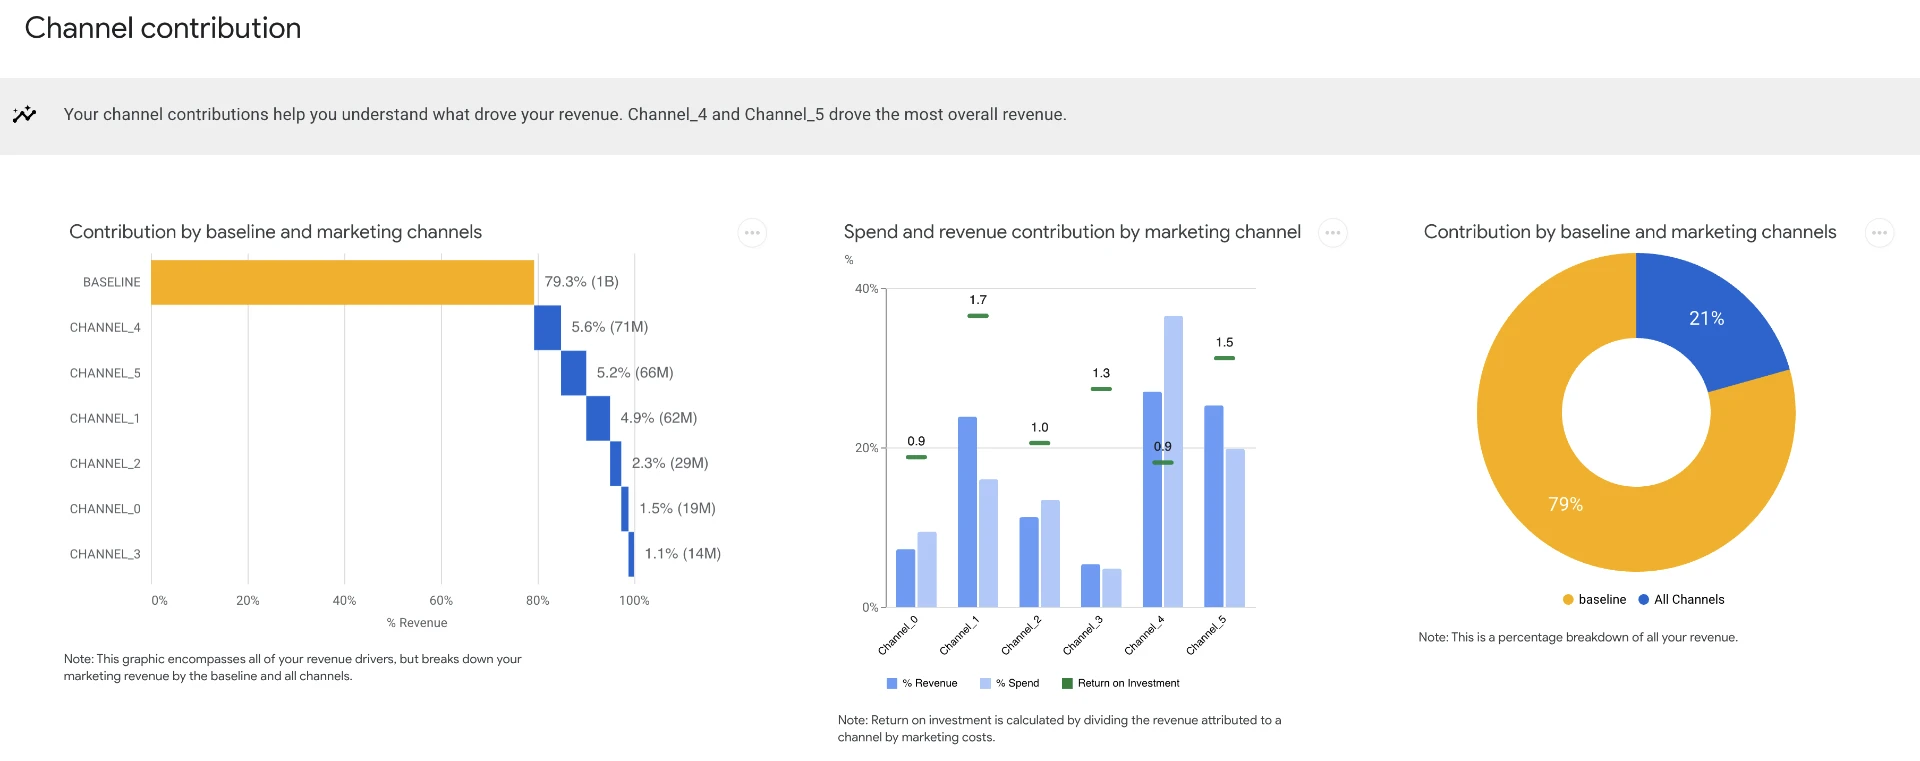
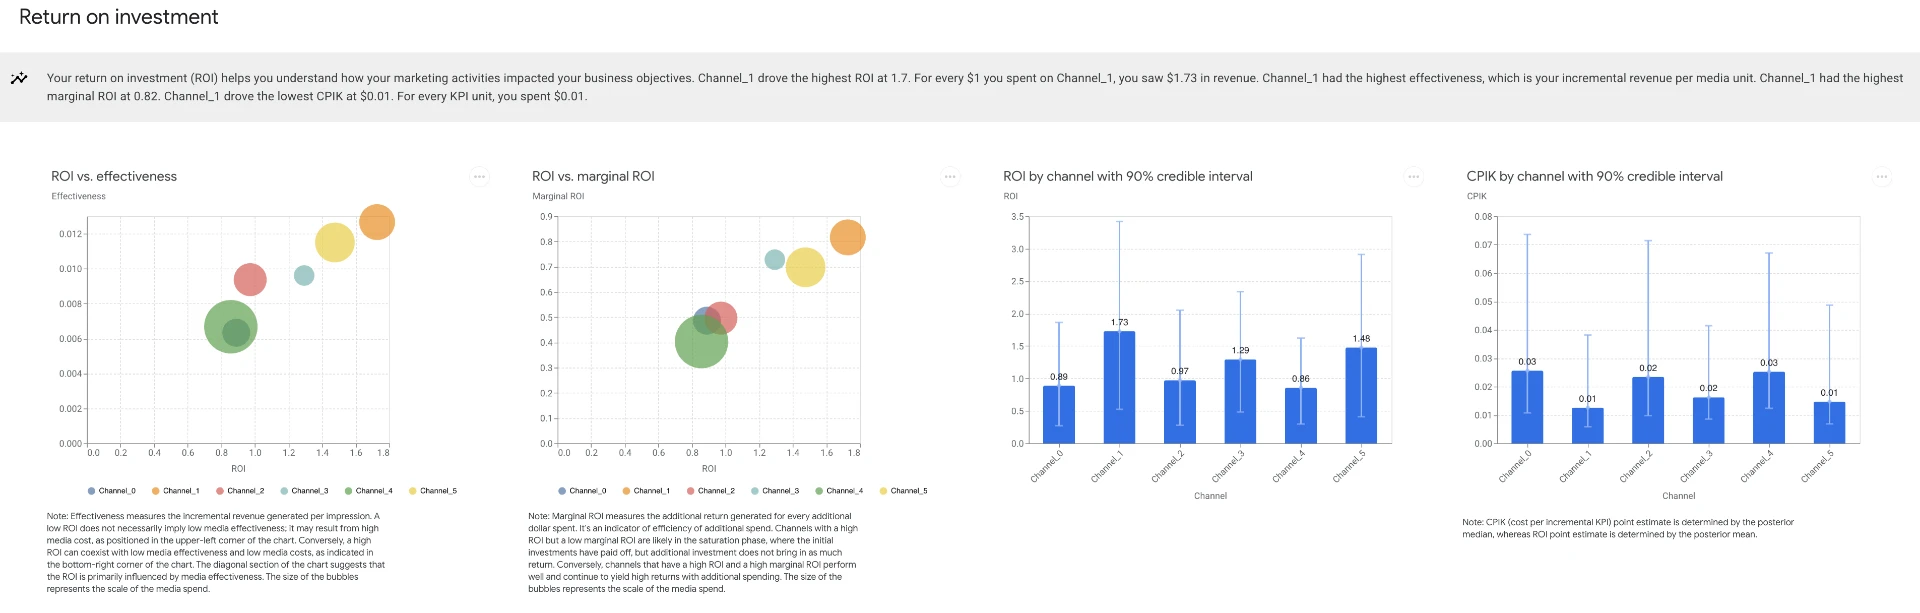
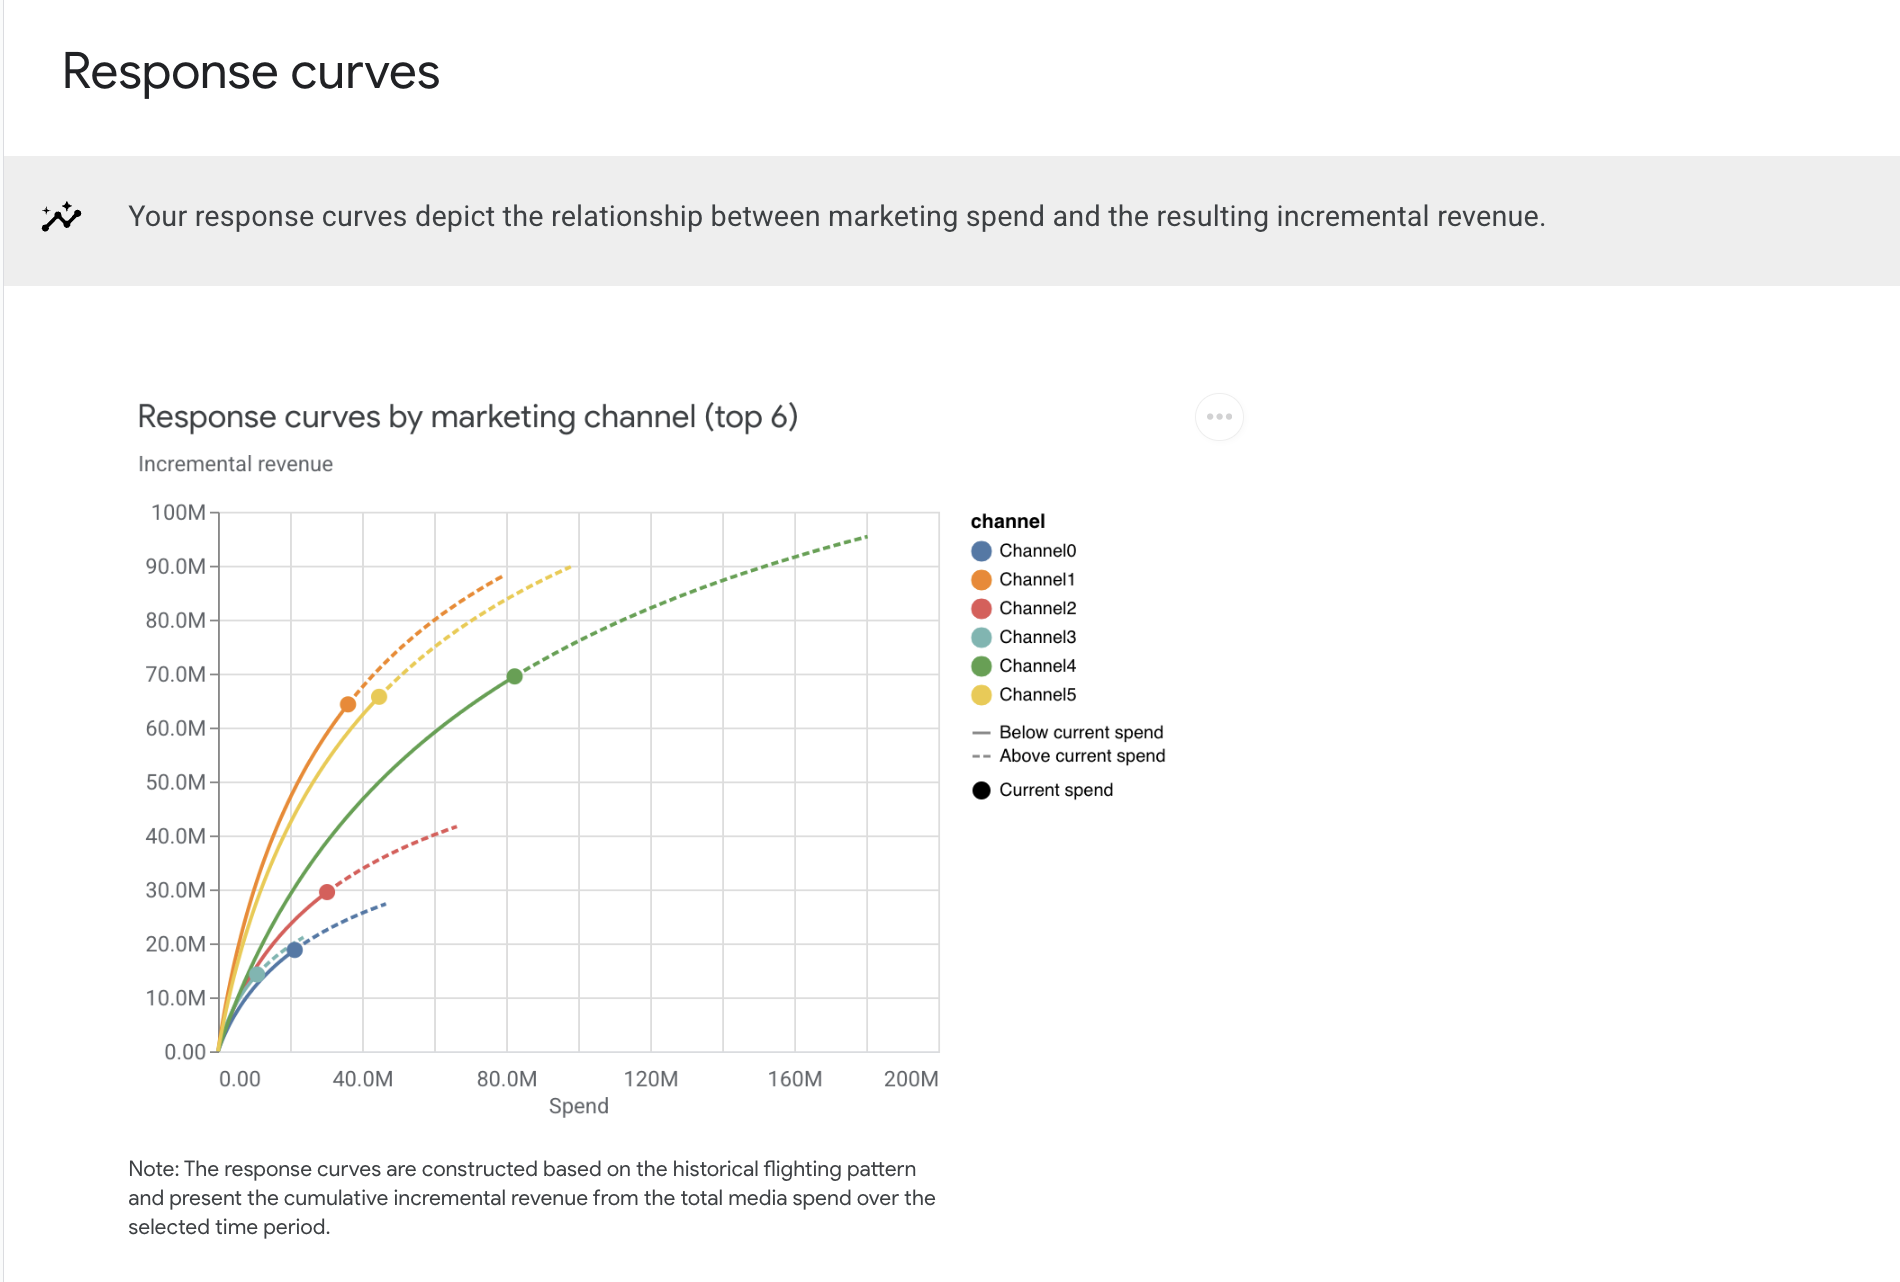
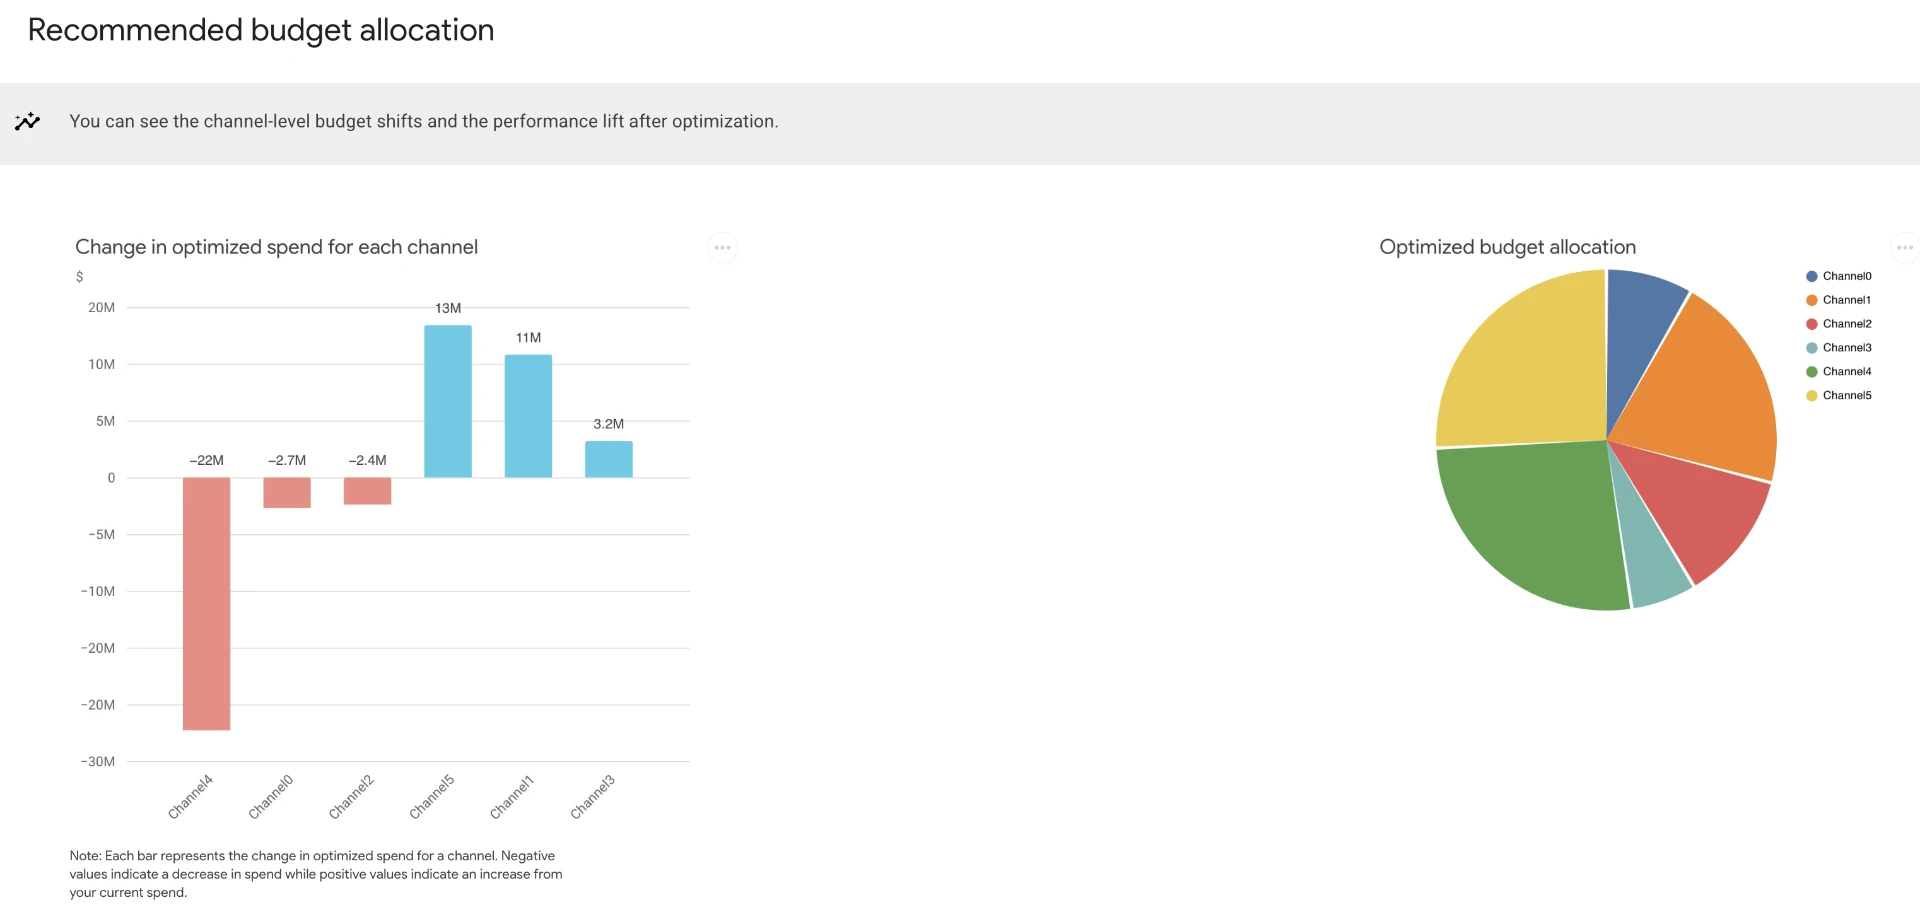
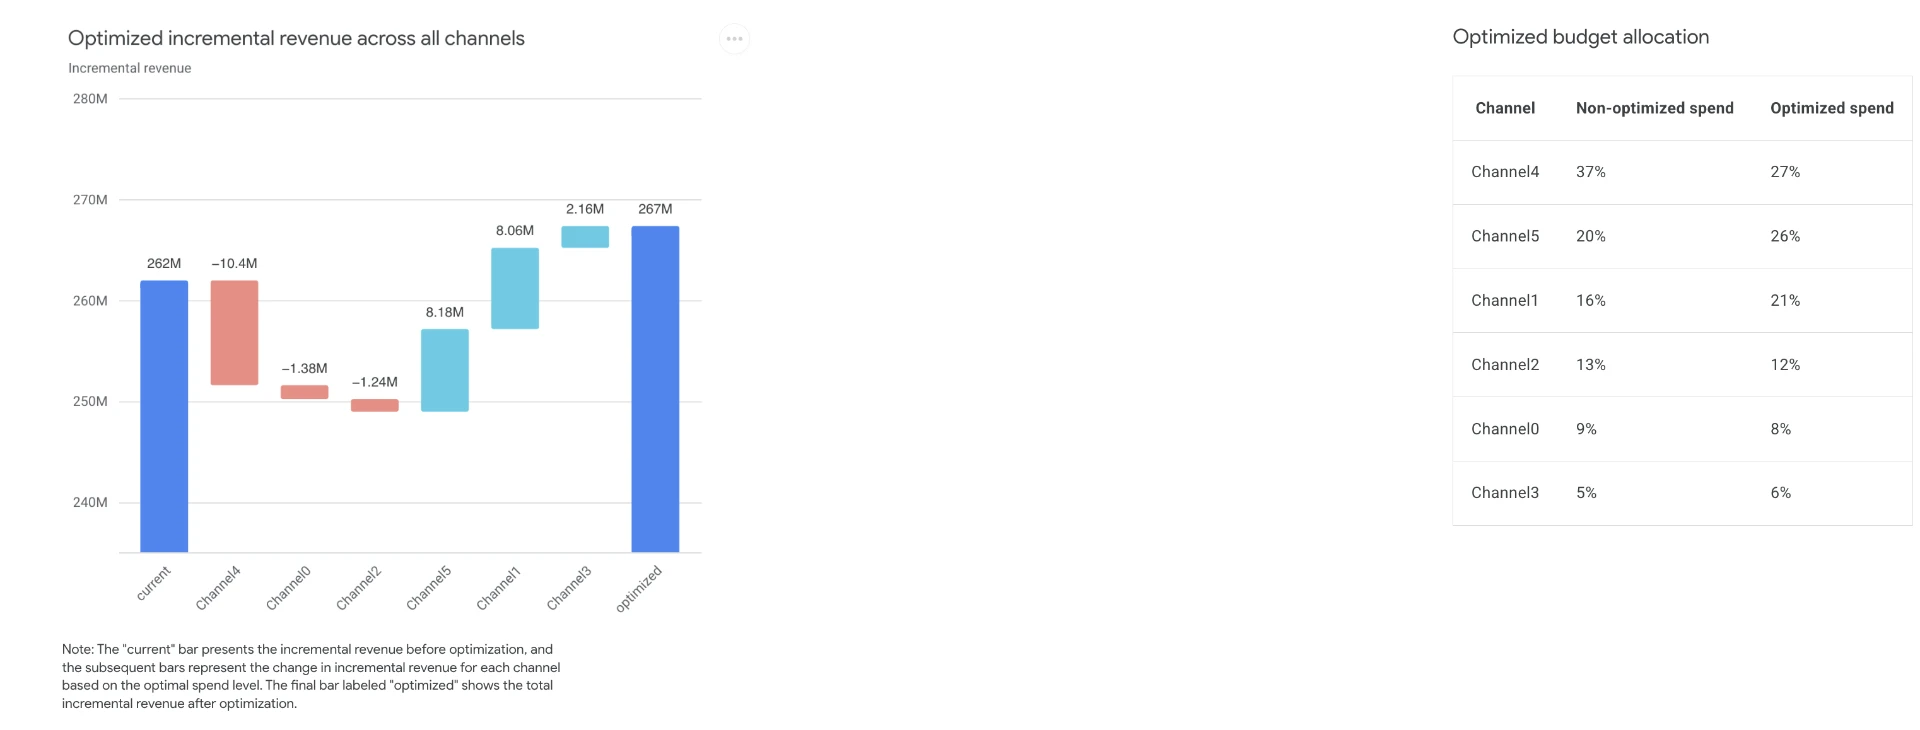
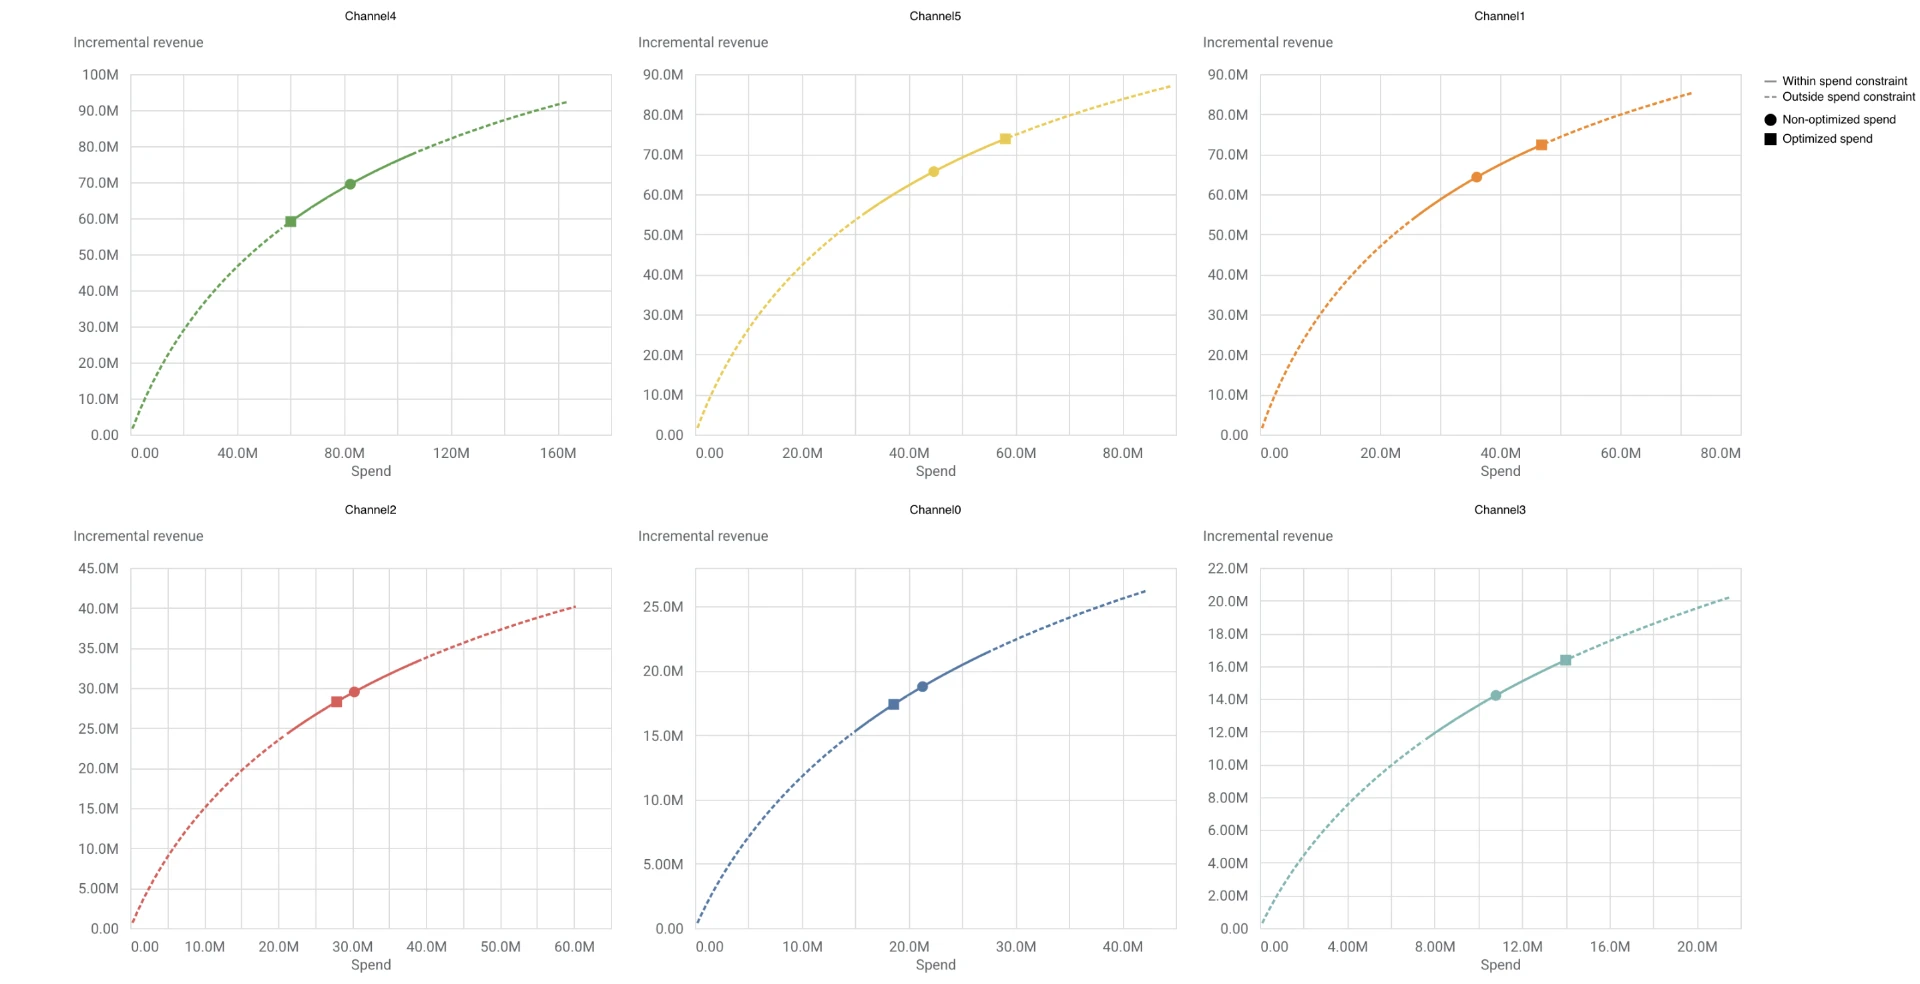
Example output from a model run on sample data. Channel names are anonymized.
What we need from you
At least 2 years of data for everything:
- Your KPI
- The business metric to explain, such as revenue, sales or sign-ups.
- Marketing activity
- Spend and activity for each channel and platform.
- Control variables
- Factors that affect the KPI but are not marketing, such as competitors, discounts and price.
Where we build it
It's flexible: we can develop the model in our environment, or directly in yours.
What you receive
- An HTML report with charts and results
- CSV files with the results
- A PowerPoint presentation that we walk you through